Tuesday, July 28, 2015

Limit of Sigma? Python to the Rescue!

I got an email today from a college student I tutor:
Hey Peter, there's a problem in the sigma notation section to find the limit as n goes to infinity, i=1 ending at n that goes like: 2/n((2i/n)^3+5(2i/n)). Please help! Thank you.
Translating a complicated problem into an email isn't easy. This is how the problem looks in a textbook:

It's been a long time since I forced myself to solve sigma problems by hand, so the first thing I did was set up a Python program to make i go from 1 to n and return the sum:

Python 2 will round this off to whole numbers, so I added the "from __future__" line to tell it to use decimals. I discuss this in my book Hacking Math Class with Python

Now I ran the program and made n a million. It's not infinite, but it should give an idea of what the sum is as n gets really large.


Looks like it gets really close to 14. The algebraic solution requires that we separate the n's and the i's. 

At this point you can replace the sigma-i's with their equivalent expressions in n. It's in every calculus book:
Making the substitutions and slogging through the algebra:


 Now we can stop and let n get really large. That will just make all the terms with n's in the denominator get really small. We can replace them with 0's.

4(1 + 0 + 0) + 10(1 + 0)
4(1) + 10(1)
14

As usual the algebraic solution is six times as long as a numerical solution using a short computer program. Thanks, Python!

Friday, March 13, 2015

Cooking Up Pi

Happy Pi Day! One day out of the year we math geeks get to show off some Pi-related trivia we've dug up. Personally I love the artsy, the musical and even the food-related Pi-ponderings out there. But I'm a "Pi-thon guy" and I'm interested in the techy aspects of Pi Day.

Everybody knows Pi is the ratio of the circumference of a circle to its diameter. The Greeks were surprised that a nice perfect 1-unit wide wheel didn't roll out a beautiful whole number in one rotation. It always rolled just over 3 units. 3 and a half? Not even close. 3 and a quarter? Not quite. 3 and an eighth? Pretty close. 3 and a seventh is a good approximation, and in textbooks for centuries 22/7 stood in as the simple version of pi.

2,000 years ago Archimedes used the ratio of the perimeter of a 96-sided polygon to its diameter to get a really accurate approximation: between 3 + 10/71 and 3 + 10/70. Around 3.14185

About 600 years later in China, Zu Chongzhi used a 12,288-sided polygon (!) to improve the approximation to 3.1415929. How good is this approximation for all practical purposes? Well, the orbit of Jupiter is pretty close to a circle with a radius of 483,800,000 miles. So the 3 ten-millionths of error in Zu's value of pi corresponds to about 240 miles in arc of the orbit of Jupiter.

But at this very second a bunch of supercomputers somewhere are cranking out millions and millions more digits of pi. How do we get so precise? A history lesson is in order.

A few years ago some lucky homeschoolers attended my Math Through Technology course and they learned how Issac Newton extended Pascal's Triangle backwards (!) to get a formula for
(a + b)n

when n is negative. It was an infinite series that worked for numbers less than 1:

1/(1 + x) = 1 - x + x2 - x3 + ...

When the methods of Calculus got out, mathematicians found a formula for the derivative of the arctangent of a number:

(d/dx) atan(x) = 1/(1 +x2)

Looks similar! We can just replace x with x2 , integrate the terms one by one and we have an infinite series for arctangent:

(d/dx) atan(x) = 1/(1 +x2)

(d/dx) atan(x) = 1 - x2 + x4 - x6 + ...


If you've ever gotten up to Precalculus or Trigonometry you might wonder why all of a sudden they stop using degrees and start using radians. It's actually supposed to make finding arc lengths easier, but it can be confusing to see all those pi's. For example, instead of 45 degrees, you say "pi/4". The tangent of 45 degrees, I mean pi/4, is 1, so the arctangent of 1 is pi/4. The European mathematicians thought they were so bright in changing their series to:


Just add up a few fractions, multiply by 4 and we clever Europeans have pi to as many places as we want! Two problems: this formula was already well known to the folks in India (perhaps the Jesuits brought it back?) and it converged so slowly that it was almost useless. I illustrate this in my book Hacking Math Class Using Python. You can write a Python program to use a certain number of terms to calculate pi using the series:


Only 2 correct decimal places after 1,000 terms? A better series was needed. In the 1700s John Machin was playing around with tangent formulas. He started with the 45-degree right triangle. The tangent here is 1.


Machin inserted 4 triangles with a tangent ratio of 1/5 and nearly got to pi/4:


It was just a tiny bit off. Some tangent formulas made it easy to calculate just how far off.


Machin's improvement on the pi formula is as follows:


In Hacking Math Class I show you how to adapt the Python code above to return the arctan and then call it from a "machin" function.

def arctan(x,depth):
    x = float(x)
    runningSum = 0
    for i in range(depth):
        term = (-1)**i*(x**(2*i+1)/(2*i+1))
        runningSum += term
    return runningSum

def machin(depth):
    return 4 *( 4*arctan(1./5.,depth)- arctan(1./239.,depth))

Now using only 10 terms of the series (not an unreasonable amount of effort for an 18th century mathematician), we get 10 correct digits of pi!


Of course in the centuries since Machin there have been many more series found to approximate pi. Check them out on Wolfram Mathworld and code them in Python!

Monday, March 2, 2015

Hacking Math Class: The Book

It seems like a century ago I learned from Seymour Papert that everything worth doing in math can be done using a computer. I learned enough Logo to make turtles walk around a screen and make geometrical figures, and I knew I was onto something every math student could use. After that every math class I taught had a computer component, much to the confusion of administrators and even my fellow math department members.

Years later I learned Python so I could help a computer-philic homeschooled kid explore math topics by writing programs. He excelled and his family was very supportive of my methods. I kept all the explorations we did and was inspired to do more exploring on my own.

The outcome of all this activity is Hacking Math Class With Python: Exploring Math Through Computer Programming, a 130-page book available for download on my website. It starts with an introduction to the Python programming language and its excellent turtle module. Those hardworking turtles are made to do everything from simple geometry to graphing polynomials to drawing fractals to transforming figures using matrices. Unique in its approach to math education, the book contains all the code necessary to explore math topics from arithmetic to differential equations.

Derivatives? Integrals? There are explorations in the book to help visualize Calculus problems and to show how easy it is to find numerical solutions. Vectors? They're the key to interactive graphics and animation, so why not have students write programs to make objects fly around the screen?

Every math textbook has a picture of a Mandelbrot Set, but until now none would actually teach the reader to draw one. That's because it would take you a year to iterate all those complex numbers without a computer. Hacking Math Class leads you step-by-step through the program.

Python is an excellent first language to learn, and there are plenty of people making a fine living programming in Python. The book presents the basic tools of programming and shows how powerful those tools can be. The reader is expected to install Python and code along. It's not "easy," but it rewards a bit of effort! Enjoy.


Wednesday, January 14, 2015

Hail to the Exec

Today a student in my Python programming class was working on printing out letters on a set of 4 blinkytapes. He'd already spent a lot of time defining functions for how to print out each letter of the alphabet. He called the functions "letterA()" and "letterB()" and so on. Now he wanted to print out whatever the user types in. It's easy to get input from the user:


Then you can loop through the "word" letter by letter:


But the question is how to execute the "letterA()" function when the user types in "a." He was going to use a long list of if statements (he figured copying and pasting would save him a lot of typing) but as usual Python has an easier way.

exec()


There's a function called "exec" which will execute the code inside the parentheses. So my student could put some strings in the argument:


This means he should have just called his functions "a()" and "b()" and so on. But instead of having him change every function name, I suggested he put in this code:


This changes the letter to uppercase (just like it is in his function names), puts the string "letter" on the front of it and adds the parentheses on the end. Executing this is just like executing the code "letterA()".

If the user enters more than one letter, the code just replaces the "a" with a "b" or "c" as needed:


But on the blinkytapes (a string of 60 LEDs) the letters are a function of their starting LED, like letterA(20).

We decided to write a letter for every 6 LEDs so we changed the code to

Python didn't like concatenating the strings to the integer x, so we changed x to a string:


This worked perfectly. Here's a picture of his blinkies. His classmate typed in "yolomcswag."


Tuesday, December 30, 2014

Unforgivable Math Pun Alert: Getting Triggy With It


Had fun at a local library looking through the book Trigonometric Delights by Eli Maor, the author of one of my favorite math-geek books, e: The Story of a Number. Maor often approaches math problems from an unexpected angle and in Chapter 7 he tackles the equations behind the artsy toy from the '70s, the Spirograph.

For those familiar with polar equations, it's easy to figure out the coordinates of point C in the figure (the center of the small circle) with respect to O, the origin. But it's more difficult to find out the coordinates of point P with respect to O. This alone would make a great trig exploration for somebody's precalculus class. But Maor points out that the angles of rotation, theta and phi, are not independent; the arc lengths on the two circles must be equal (because their circumferences are connected by the gears). He substitutes phi = [(R - r)/r]*theta to get everything in terms of theta:

Now that's a couple of parametric equations that were made for a computer! Let's get a turtle to play Spirograph.

Since Python makes a distinction between uppercase R and lowercase r, I could put those equations in almost verbatim. But there's no symbol for theta, so I created a variable "theta."


The rest of the Python code (available here) is just a loop so the turtle goes to that x,y coordinate, then increase theta a little, recalculate x and y and go to that coordinate, over and over and over. But what I got out wasn't what I expected.

None of the output had curved loops, but pointed ends instead. Then I realized that Maor's equations assumed the "pen" was right on the edge of the smaller circle, not somewhere in the middle. I added a variable p for "proportion" to the second term of the formulas:


That got me a much more realistic Spirograph:

Later in the chapter Maor deals with cases of different ratios of R/r, such as 2, when you simply get a horizontal line. "Even more interesting is the case R/r = 4," when you get a four-pronged thingy:

"Interesting"? I don't know, but if you change the proportion variable, you get a slightly different thingy. 


Keep going with this Maor says you get an "Astroid," which looks like this:

So I modified my code to draw a thingy (theta goes from 0 to 2*pi), then lower the proportion variable and draw another one and so on. I didn't get an astroid but something wholly unexpected:


This is something that can't be made with the physical Spirograph, but using computers and extending patterns, a lot of interesting things suddenly become possible!

Even changing the proportion so it goes up rather than down didn't get me the textbook astroid:


I'm trying to decide which one to call "The Farrell Hypercycloid."

Friday, October 31, 2014

A Recipe for Transformation

I first learned about matrices in a Business Math course in college and we painstakingly manipulated them by hand. It was not love at first sight.

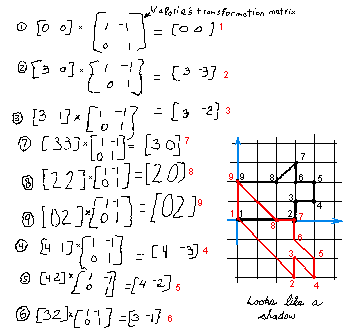
But now it's 2014 and students are still multiplying matrices by hand and are never getting to see their transformational power. I say that literally because matrices are used to transform (rotate, reflect, translate) points in a 2 or 3-D plane. What would video games be without rotation matrices? That's right: Pong.

Unfortunately many textbooks neglect this graphical application which could be used to grab students' attention. Good for us Don "The Mathman" Cohen didn't neglect it. On the contrary, he and his very young students graphed a simple "dog" and multiplied its points one by one and graphed the result. Their work can be found in Cohen's characteristically clear, engaging and thought-provoking book "Changing Shapes with Matrices."


When I was working with a homeschooled Algebra 2 student on matrices, we used Python and its professional-strength numerical package Numpy to multiply and transform our matrices.

But if you're just using a 2x2 transformation matrix, it's not hard to write your own functions in Python to draw and multiply matrices. Since I don't have to do the multiplying by hand, I can use more points than Cohen did. I chose to transform a big F since it has no rotational or reflective symmetry and my last name starts with F. First draw it on graph paper (or Geogebra) to get the points:


Now type the points into an n x 2 matrix:


Ok, it's just a list. But we're using our imagination here. Now enter your favorite transformation matrix:


I wrote a function to connect the points in a matrix using the create_line function in Tkinter. But the important function (and one I think math teachers could benefit from assigning their students) is the one that multiplies two matrices together. a is the n x 2 matrix (it can have any number of rows) and b is the 2x2 transformation matrix:


The above code isn't obvious. i needs to go up by 2 in order to skip from point to point, and j only has 2 values. But the a[i]*b[j] line is especially guaranteed to challenge math students! It'll make them think about how you multiply matrices, that's for sure:


Now just have the program multiply the F-matrix by the transformation matrix and graph the result:


This transformation matrix reflects every point across the line y = -x. Or is it a rotation, then a reflection? Change one number in your transformation matrix and you'll get a shear in the vertical direction:


Notice the new x-value is the old y-value and the new y-value is the negative of the sum of the old x- and y-values. I think this is exactly the kind of exploration math students should be getting so they can experience transformations and matrices first hand. I suspect this can all be done with a couple of keystrokes in IPython but doing some real programming to multiply matrices and graph the result is a great exercise!

Wednesday, October 8, 2014

Making the Mandelbrot

I've taught students to draw fractals like the Koch Snowflake in Logo and Python. The Sierpinski triangle and the Dragon Curve aren't hard to figure out, either. But the Mandelbrot Set always seemed like a different animal altogether. Sure, every math textbook has pictures of the famous pear-shaped fractal, but none teach you how to create it. Students and teachers get the feeling it must be something unapproachable, requiring years of training, but, predictably enough, a computer makes it easy.

It boils down to taking a point in the complex plane and iterating it using the formula:


c is a complex number of the form a + bi, where i is the square root of -1. Z is set to 0 initially, then you square it and add c. The result becomes the new Z. Square it and add c. Repeat a bunch of times. I think it's a great exercise for Precalculus students to write a program to do this.

As Paul Lutus explained visually, most points will get really large, and fly off out of the "control radius":


the ones that stay within the control radius are in the Mandelbrot Set.


So at first the set of points that don't fly off is big:


But iteration by iteration more and more points fly off ("diverge") and the blob starts to take the shape we know and love:


The challenge is how to take points (especially ones with a real part and an imaginary part) and put the coordinates into a function over and over. Many online examples require the use of numpy and other (very useful) Python add-ons, but I wanted to do it with only "stock" Python tools.

First I had to define a function to square the complex number a bunch of times. Every programming language has a way to handle lists, and Python's way is pretty easy. I made a 2-item list of numbers: the first item is the real part of the complex number and the second item is the imaginary part. Here's how to represent the complex number 2 + 3i:


Anybody familiar with multiplying polynomials can get their noggin around this:


The only thing separating this Precalculus exercise from an Algebra one is imaginary numbers, which I've mentioned before. When the imaginary part is squared it becomes real but negative. Now squaring complex numbers is easy:


This means the square of 2 + 3i is -5 + 12i and the square of 1 - i is -2i (the real part of the last list is zero).

Now it's just a matter of calling the squareZ function then adding c back in. This next function just tells you whether the squaring-adding is making the numbers get really big. If so, the original c is not in the Mandelbrot set.


If after all your iterating the point hasn't gotten more than 2 units away from the origin it's in the Mandelbrot set. So in the above blobs that point would be colored black. That was the tricky part. What's the best way to display the results? Will the easiest way look the best?

The original output in 1978 was text, and Paul Lutas' page contains the code needed to generate it. Here's my version, which didn't all fit on the screen at once:


It's exciting just to get that far! But I knew my students would probably want something more professional looking.

In his excellent book Python for Kids, Jason Briggs showed how to use Tkinter, the default graphics module in Python, to draw shapes and create a video game. So in my program the loops go through the rows and columns of the screen, iterating each point and coloring those in the Mandelbrot Set black. In an 800 x 800 screen that means it has 640,000 points to iterate!

To set up the screen, you have to import tkinter and put this code at the top of the program:


Finally, the main loop of the program looks like this:


The program starts at (xlow, ylow) and checks the point. If it stays within the control radius after 20 iterations it creates a one-pixel black square, otherwise it doesn't do anything and moves on to the next point. Here's how it looks:


The color pictures you see online are made by coloring the points that diverge every step. This requires some changes to the code (which I'll spare you) but it makes it look pretty. You'll recognize the colored shapes as the black blobs from above:


Python is a (relatively) easy way to explore ideas like iteration that would otherwise be impossible with just pencil and paper. Try it!