This past week my son was working on calculating the percent increase or decrease between a beginning and an ending value. He had written out the formula a bunch of times:
percent = (ending - beginning) / beginning * 100
Then he dutifully plugged in the values and if he didn't make any careless mistakes, he'd get the answer. I saw so much repetition that I offered to help him automate the process.
The above formula is perfect for putting straight into Python. Then all we need from the user is the beginning value and the ending value. Sounds like the parameters of a function:
def perc(beginning, ending):
'''prints the percent increase or decrease between
a given beginning value and ending value.'''
percent = (ending - beginning) / beginning * 100
return percent
This will give us a positive or negative number, but it might be a long decimal. We can make it round off to two decimal places by replacing the last line with this:
return round(percent,2)
So if it's positive, it's an increase and it it's negative it's a decrease. We might make it more user friendly by asking the user for input:
beginning = float(input("Enter the beginning value: "))
ending = float(input("Enter the ending value: "))
In Python, user input is assumed to be a string. "Float" changes it into a decimal. But now you have to change the "return" statement to a "print" statement:
print(round(percent,2))
So the output looks like this:
Enter the beginning value: 115
Enter the ending value: 73
-36.52
That might be enough, but for some students adding "percent" and "increase" or "decrease" might be helpful.
if ending - beginning > 0:
change = 'increase'
else:
change = 'decrease'
print(round(percent,2),"%",change)
Now the output is more descriptive.
Enter the beginning value: 21
Enter the ending value: 23
9.52 % increase
Not every Python exploration has to be rocket science! This 7th-grade math problem was perfect for automating.
Sunday, May 8, 2016

Wednesday, April 13, 2016
Hacking Matrices And Gauss
I was invited to teach a lesson at a not-so-nearby high school and was told exactly the topic the class would be learning that day: matrices (yay!), specifically, solutions of linear systems by Gaussian elimation (awww...).
My heart sank because I can remember a hot autumn day (or did it last a week?) decades ago, when my brother and I were sitting in a business math class at Merrimack College being led through this exact topic by a teacher-in-training. It ranked among the most boring episodes in my educational experience. And pointless, too. Why were we going through all this? Because we had matrices to solve, I guess.
More recently I've posted about the more interesting, visual, interactive applications of matrices in 3D graphics:
So I worked through a few problems in Gaussian elimination to refresh my memory and predictably enough, I thought about automating this boring stuff with Python. Sure, you can just use Numpy's Linear Algebra module to solve them. Let's solve this example (from Wikipedia):
You have to put the coefficients and constants into matrices like this and type a few words to get the solution:


Then you do the same thing to the second row, second column and make the other entries 0, and the same thing for the third row, third column, etc. I could smell a loop. You just need to have a list of rows and take out the one that's on the diagonal:
rowList = [x for x in range(len(A))]
rowList.remove(j)
I also needed to make sure we weren't dividing by zero. The whole function ended up being less than 20 lines:


My heart sank because I can remember a hot autumn day (or did it last a week?) decades ago, when my brother and I were sitting in a business math class at Merrimack College being led through this exact topic by a teacher-in-training. It ranked among the most boring episodes in my educational experience. And pointless, too. Why were we going through all this? Because we had matrices to solve, I guess.
More recently I've posted about the more interesting, visual, interactive applications of matrices in 3D graphics:
So I worked through a few problems in Gaussian elimination to refresh my memory and predictably enough, I thought about automating this boring stuff with Python. Sure, you can just use Numpy's Linear Algebra module to solve them. Let's solve this example (from Wikipedia):
2x + y - z = 8
-3x - y + 2z = -11
-2x + y + 2z = -3
You have to put the coefficients and constants into matrices like this and type a few words to get the solution:

That means x = 2, y = 3 and z = -1. Check it by plugging those values into the original equations.
But maybe using modern-day solvers is cheating. This is math class, after all. Best to learn to make a solver yourself. I started by dividing the whole first row by the element in the first column. To use a list's values and their place in the list (their index), Python has a handy function called "enumerate." For example, declare a list like this and print the index and value of each item:

Using enumerate, it was easy to divide all the values in the first row (index 0) by the value of the top left entry.
#get top left entry to be 1
#by dividing row by A[0][0]
divisor = A[0][0]
for i,v in enumerate(A[0]):
A[0][i] = v / divisor
The next step was making the other elements in that column 0 by adding the negative of those values. Like in our example, the first item in the second row is -3. So to everything in that row we add 3 times the corresponding entry in the first row. Do the same thing for the third row. So having the index and the value of each entry in the matrix is crucial.
#add row 2 and 3 to additive inverse to make value 0
for i in [1,2]:
addinv = -1*A[i][0]
for ind,value in enumerate(A[i]):
A[i][ind] = value + addinv*A[0][ind]
Then you do the same thing to the second row, second column and make the other entries 0, and the same thing for the third row, third column, etc. I could smell a loop. You just need to have a list of rows and take out the one that's on the diagonal:
rowList = [x for x in range(len(A))]
rowList.remove(j)
I also needed to make sure we weren't dividing by zero. The whole function ended up being less than 20 lines:

But does it work? Let's use our Wikipedia example. I entered the matrix in augmented form, meaning it was a 3x4 matrix:
My function returned the entire matrix, but if you look at the last values in each row, those are the solutions for x, y and z.
The great thing is this function even works for bigger matrices. If you had a system of 4 unknowns, you'd need 4 equations like this:
4w + x + 2y + 3z = 6
3w - 6x + 5y + 4z = 1
9w + 7x - 7y + 8z = 4
w + x + y - z = 1
That would be cruel to make a student do by hand, but using our function, the worst part is just typing it all in:

The last numbers in each row are the solutions for w, x, y and z. Checked it with numpy:
>>>
[[-1.01875]
[ 1.8375 ]
[ 1.75625]
[ 1.575 ]]
One of the questions the students asked was to find the equation of a parabola given 3 points like this:
We know it's a parabola, so the solution is in the form
y = ax2 + bx + c
and we know 3 pairs of x and y coordinates, so it's a system of equations to solve for a, b and c:
(2) = a(-2)2 + b(-2) + c
(-1) = a(1)2 + b(1) + c
(-6) = a(2)2 + b(2) + c
or
4a - 2b + c = 2
a + b + c = -1
4a + 2b + c = -6
No problem solving this with gauss():

The solutions are a = -1, b = -2 and c = 2. So the equation of the parabola is
y = -x2 - 2x + 2
There are plenty of computer-based and online tools to solve linear systems using matrices. We should be teaching our math students how to make the tools themselves.
Tuesday, April 5, 2016
Automata to Pyramids
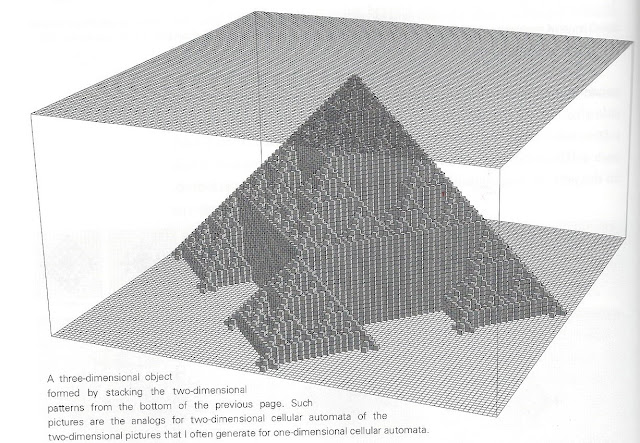
Was flipping through Steven Wolfram's A New Kind of Science and was struck by the picture of the steps in the evolution of this 2D cellular automaton:

If every step became a level in a 3D shape, it'd look like this:
I'm motivated to try this out in Python. The first challenge is to create an array. It's easy enough to type in an 11x11 array for step 0 manually:
surface = [[0, 0, 0, 0, 0, 0, 0, 0, 0, 0, 0],
[0, 0, 0, 0, 0, 0, 0, 0, 0, 0, 0],
[0, 0, 0, 0, 0, 0, 0, 0, 0, 0, 0],
[0, 0, 0, 0, 0, 0, 0, 0, 0, 0, 0],
[0, 0, 0, 0, 0, 0, 0, 0, 0, 0, 0],
[0, 0, 0, 0, 0, 1, 0, 0, 0, 0, 0],
[0, 0, 0, 0, 0, 0, 0, 0, 0, 0, 0],
[0, 0, 0, 0, 0, 0, 0, 0, 0, 0, 0],
[0, 0, 0, 0, 0, 0, 0, 0, 0, 0, 0],
[0, 0, 0, 0, 0, 0, 0, 0, 0, 0, 0],
[0, 0, 0, 0, 0, 0, 0, 0, 0, 0, 0]]
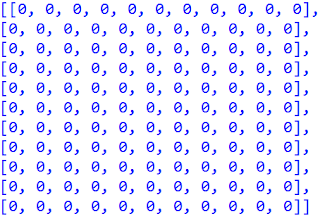
But we eventually want a bigger array. It should be easy to create, right? Here's the code for it:
tableSize = 11
surface = tableSize*[tableSize*[0]]
Which gives us a 11x11 array of all zeroes.
The code for making the middle one a 1 is this:
surface[int(tableSize/2)][int(tableSize/2)] = 1
Strangely, that produces this!
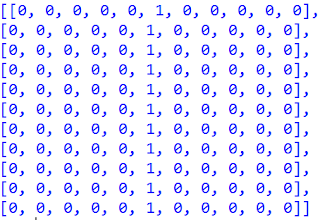
I have no idea why this glitch is happening, so let's switch to Numpy, Python's professional-strength array-wrangling package. The code for making the array is easier, and it works:
tableSize = 101
surface = numpy.zeros((tableSize,tableSize))
surface[int(tableSize/2)][int(tableSize/2)] = 1
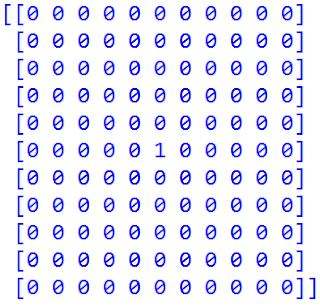
Now I can make a monster array just by changing the tableSize variable.
Now the question is how to produce the pattern in the first picture. For each cell, the program has to check its four neighbors (left, right, up, down) and see whether exactly 1 or 4 of the neighbors is a 1. If so (or if the cell itself is a 1), the cell is a 1 in the next level. This function will count the number of 1's among a cell's four neighbors:
def nbs(listA,r,c):
'''counts the 1's in the 4 neighbors of a cell'''
neighborList = []
neighborList.append(listA[r-1][c])
neighborList.append(listA[r][c-1])
neighborList.append(listA[r][c+1])
neighborList.append(listA[r+1][c])
#count the 1's in the list
return neighborList.count(1)
The function for the level needs to go through every row and column, check the neighbor number of the cell, and create the next level's cell. I called it "wolfram" after the author who inspired the exploration. The "enumerate" function is getting a workout.
def wolfram(level):
'''returns the array for level'''
#make the level 0 array
tableSize = 11
surface = numpy.zeros((tableSize,tableSize))
surface[int(tableSize/2)][int(tableSize/2)] = 1
for i in range(level): #repeat for each level
newSurface = [] #empty list for next level
for r,u in enumerate(surface): # for each row in array
newSurface.append([]) #empty list in next level
for c,v in enumerate(u): # for every item in row
#if it has exactly 1 or 4 neighbors that are 1's
if nbs(surface,r,c) in [1,4] or v == 1:
newSurface[r].append(1) #put a 1 in next level
else: #otherwise
newSurface[r].append(0) #put a 0 in next level
#replace the old level with new one for next loop
surface = newSurface
return numpy.array(surface)
Unfortunately, this gives me an error when checking the cells on the sides of the array.
IndexError: index 11 is out of bounds for axis 0 with size 11
The "nbs" function has to be adjusted so it won't panic if there isn't a previous row or next column. The exception keyword in Python comes in handy again. Now I can tell it to "try" searching the neighbors and if it gets a urge to throw an IndexError at me, just move on.
def nbs(listA,r,c):
'''puts 4 neighbors of a cell into a list'''
neighborList = []
try:
neighborList.append(listA[r-1][c])
neighborList.append(listA[r][c-1])
neighborList.append(listA[r][c+1])
neighborList.append(listA[r+1][c])
except IndexError:
pass
return neighborList.count(1)
Now printing "wolfram(3)" gives me an array representing the 4th step in the first picture:
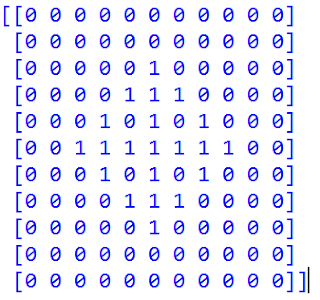

Finally I fire up the Raspberry Pi version of Minecraft and use the "setBlock" function to create the pyramid in a 3D world!


If every step became a level in a 3D shape, it'd look like this:

I'm motivated to try this out in Python. The first challenge is to create an array. It's easy enough to type in an 11x11 array for step 0 manually:
surface = [[0, 0, 0, 0, 0, 0, 0, 0, 0, 0, 0],
[0, 0, 0, 0, 0, 0, 0, 0, 0, 0, 0],
[0, 0, 0, 0, 0, 0, 0, 0, 0, 0, 0],
[0, 0, 0, 0, 0, 0, 0, 0, 0, 0, 0],
[0, 0, 0, 0, 0, 0, 0, 0, 0, 0, 0],
[0, 0, 0, 0, 0, 1, 0, 0, 0, 0, 0],
[0, 0, 0, 0, 0, 0, 0, 0, 0, 0, 0],
[0, 0, 0, 0, 0, 0, 0, 0, 0, 0, 0],
[0, 0, 0, 0, 0, 0, 0, 0, 0, 0, 0],
[0, 0, 0, 0, 0, 0, 0, 0, 0, 0, 0],
[0, 0, 0, 0, 0, 0, 0, 0, 0, 0, 0]]
But we eventually want a bigger array. It should be easy to create, right? Here's the code for it:
tableSize = 11
surface = tableSize*[tableSize*[0]]
Which gives us a 11x11 array of all zeroes.

The code for making the middle one a 1 is this:
surface[int(tableSize/2)][int(tableSize/2)] = 1
Strangely, that produces this!

Numpy to the Rescue
tableSize = 101
surface = numpy.zeros((tableSize,tableSize))
surface[int(tableSize/2)][int(tableSize/2)] = 1

Now I can make a monster array just by changing the tableSize variable.
Automating the Pattern
def nbs(listA,r,c):
'''counts the 1's in the 4 neighbors of a cell'''
neighborList = []
neighborList.append(listA[r-1][c])
neighborList.append(listA[r][c-1])
neighborList.append(listA[r][c+1])
neighborList.append(listA[r+1][c])
#count the 1's in the list
return neighborList.count(1)
The function for the level needs to go through every row and column, check the neighbor number of the cell, and create the next level's cell. I called it "wolfram" after the author who inspired the exploration. The "enumerate" function is getting a workout.
def wolfram(level):
'''returns the array for level'''
#make the level 0 array
tableSize = 11
surface = numpy.zeros((tableSize,tableSize))
surface[int(tableSize/2)][int(tableSize/2)] = 1
for i in range(level): #repeat for each level
newSurface = [] #empty list for next level
for r,u in enumerate(surface): # for each row in array
newSurface.append([]) #empty list in next level
for c,v in enumerate(u): # for every item in row
#if it has exactly 1 or 4 neighbors that are 1's
if nbs(surface,r,c) in [1,4] or v == 1:
newSurface[r].append(1) #put a 1 in next level
else: #otherwise
newSurface[r].append(0) #put a 0 in next level
#replace the old level with new one for next loop
surface = newSurface
return numpy.array(surface)
Unfortunately, this gives me an error when checking the cells on the sides of the array.
IndexError: index 11 is out of bounds for axis 0 with size 11
The "nbs" function has to be adjusted so it won't panic if there isn't a previous row or next column. The exception keyword in Python comes in handy again. Now I can tell it to "try" searching the neighbors and if it gets a urge to throw an IndexError at me, just move on.
def nbs(listA,r,c):
'''puts 4 neighbors of a cell into a list'''
neighborList = []
try:
neighborList.append(listA[r-1][c])
neighborList.append(listA[r][c-1])
neighborList.append(listA[r][c+1])
neighborList.append(listA[r+1][c])
except IndexError:
pass
return neighborList.count(1)
Now printing "wolfram(3)" gives me an array representing the 4th step in the first picture:

On to Higher Dimensions
So now I can generate an array for any level I want. Time to make a huge array and place blocks for each 1 in that level. I take my file and add the code necessary to make and display a 3D model in Pi3D, my favorite 3D graphics package. Here's the relevant code for taking the levels and making them layers of the pyramid:
cubeList = [] #list for storing cubes
#loop over each level:
for i in range(50,-1,-1): #50 levels, going down to 0
rowList = wolfram(i) #get the array for that "layer"
for row,value in enumerate(rowList): #loop through the rows
for j,v in enumerate(value): #loop through the columns
if v == 1: #if the value of that cell is 1
#put a cube there
cubeList.append(pi3d.Cuboid(x=row,
y=-i,
z=j))
Then it's just a matter of iterating over the cube list and drawing all the cubes. Here's the final outcome in pi3d:


Wednesday, March 23, 2016
Minecrafting Adders
George Boole supposedly proved that every operation in math can be reduced to a combination of three operations: "and," "or" and "not." This had a great influence on the development of computers years ago. When teaching a CS class for Learningtech.org I was introduced to the Cedar Logic software, which allows you to create interactive virtual logic gates. Here's a two bit adder made from a couple of gates (four, actually):
 The two inputs on the left are on, so the output is the binary form of 2: on and off or "10."
A student (thanks, Nathan) showed me how he made logic gates in Minecraft using redstone, the game's "electrical" substance. I didn't think much more about it until recently, when I bought Craig Richardson's book on modding the Raspberry Pi's version of Minecraft using Python. It can be used on the full PC or Mac version as well, so I experimented with writing code to build houses and cities and then blow them up with TNT. It's fun!

For those students who would rather create their structures by setting blocks the old fashioned way, you can simply scan an area (ok, a volume) with the "getBlock" function and some nested loops and save each block's information for building a house in a list or .txt file. Then you can run the process backwards and recreate the structure at another location.
def duplicate(x,y,z,l,h,w):
'''saves all the blocks in an area'''
blockFile = [] #list for block info
for i in range(l): #loops through the x-values
blockFile.append([]) #starts new array for rows
for j in range(h): #loops through the y-values
blockFile[i].append([]) #starts new array for columns
for k in range(w): #loops through the z-values
#put block data in row and column array:
blockFile[i][j].append(mc.getBlock(x+i,y+j,z+k))
return blockFile

For instance, the figure above was made using this "copy and paste" procedure. The structure on the left was the original, which I copied and pasted in the middle. The data for the color of the wool and the orientation of the torches was lost. I needed to modify the getBlock function to "getBlockWithData" and then the structure in the foreground was identical to the original.
Unlike in the minimized version of Minecraft available on the Raspberry Pi, in the Windows version I could also use redstone. It made me think of Nathan and the logic gates. A web search got me the design for an AND gate. The output on the left is only on if both switches on the right are ON.

A coworker helped me "optimize my code" and make an AND gate out of less blocks:

So I made the gates from the adder at the top and connected everything with redsone. Using my duplicate function I copied and pasted the components until I had a 4-bit adder:

(My previous adder is on the bottom of the screen.) The switches are set up to add 11 + 1. In binary that's 1011 and 1. The 5 glowstone pillars at the top of the screen are the digits, and they're off, on, on, off and off, so 01100 or 12 in decimal. It works!
Getting in creative in Minecraft is a great way to learn about 3D coordinates and interacting with programs using Python. Then you get to walk around in your creation!

A student (thanks, Nathan) showed me how he made logic gates in Minecraft using redstone, the game's "electrical" substance. I didn't think much more about it until recently, when I bought Craig Richardson's book on modding the Raspberry Pi's version of Minecraft using Python. It can be used on the full PC or Mac version as well, so I experimented with writing code to build houses and cities and then blow them up with TNT. It's fun!

For those students who would rather create their structures by setting blocks the old fashioned way, you can simply scan an area (ok, a volume) with the "getBlock" function and some nested loops and save each block's information for building a house in a list or .txt file. Then you can run the process backwards and recreate the structure at another location.
def duplicate(x,y,z,l,h,w):
'''saves all the blocks in an area'''
blockFile = [] #list for block info
for i in range(l): #loops through the x-values
blockFile.append([]) #starts new array for rows
for j in range(h): #loops through the y-values
blockFile[i].append([]) #starts new array for columns
for k in range(w): #loops through the z-values
#put block data in row and column array:
blockFile[i][j].append(mc.getBlock(x+i,y+j,z+k))
return blockFile

For instance, the figure above was made using this "copy and paste" procedure. The structure on the left was the original, which I copied and pasted in the middle. The data for the color of the wool and the orientation of the torches was lost. I needed to modify the getBlock function to "getBlockWithData" and then the structure in the foreground was identical to the original.
Unlike in the minimized version of Minecraft available on the Raspberry Pi, in the Windows version I could also use redstone. It made me think of Nathan and the logic gates. A web search got me the design for an AND gate. The output on the left is only on if both switches on the right are ON.

A coworker helped me "optimize my code" and make an AND gate out of less blocks:

So I made the gates from the adder at the top and connected everything with redsone. Using my duplicate function I copied and pasted the components until I had a 4-bit adder:

(My previous adder is on the bottom of the screen.) The switches are set up to add 11 + 1. In binary that's 1011 and 1. The 5 glowstone pillars at the top of the screen are the digits, and they're off, on, on, off and off, so 01100 or 12 in decimal. It works!
Getting in creative in Minecraft is a great way to learn about 3D coordinates and interacting with programs using Python. Then you get to walk around in your creation!
Tuesday, March 22, 2016
Drawing Triangles the Hard Way
I'm a big fan of fractals, and dedicated a whole chapter of Hacking Math Class with Python to them. The Sierpinski Triangle (or "Sieve") is a famous shape that pops up in the most unexpected ways.

In my book I showed the easy way to draw one by making a turtle do it, but there's a little more complicated way that involves another famous triangle. It was known to the Chinese and Indians while we Europeans were still hiding from the Vikings, but we like to call it Pascal's Triangle after a more recent French mathematician.


The numbers can be generated by adding the numbers in the row above, but using a computer it's quicker to use the combination formula.

Here's the (Python 2) code I copied and pasted from dheerosaur on Stack Overflow:
import operator as op
...
def ncr(n, r):
r = min(r, n-r)
if r == 0: return 1
numer = reduce(op.mul, xrange(n, n-r, -1))
denom = reduce(op.mul, xrange(1, r+1))
return numer//denom
(To convert it to Python 3, just change "xrange" to "range" and add "from itertools import reduce" to the imports.)
The 1st row and column are really the 0th, so the "20" in row 7 is actually row 6, column 3:
>>> ncr(6,3)
20
How could you possibly get The Sierpinski Sieve from Pascal's Triangle? Let's use Pygame.
I use a template I found at Professor Craven's excellent Pygame tutorial. This sets up the screen and the colors and the display loop. All I have to do is draw shapes; it even updates the display and quits for me. I have to create a function to draw a triangle where I want it and what size I want it. The number (calculated with ncr above) will determine whether it's filled with color or not:
def triangle(x,y,size,filled):
'''draw an equilateral triangle'''
#if the number isn't a multiple of 2, color it in.
if filled % 2 != 0:
pygame.draw.polygon(screen,VIOLET,[[x,y],
[x-size/2.,y+1.732*size/2.],
[x+size/2.,y+1.732*size/2.]],
0)
else: thick = 0 #leave multiples of 2 empty
The "gasket" function will draw the triangles at the right spots:
def gasket(rows):
size = 400./rows #resize depending on the number of rows
for i in range(rows):
for j in range(i+1):
y = 1.732*i*size/2. #height of equilateral triangle
x = -i*size/2. + j * size + WIDTH/2. #width of triangle
triangle(x,y,size,ncr(i,j)) #draw the triangle
Now running "gasket(50)" will get you 50 rows of Pascal's triangle, with the multiples of 2 left empty:


Or the multiples of 8. The pattern of empty triangles changes every time. Try other numbers!

This blog entry has been brought to you by O'Reilly books.:-)


In my book I showed the easy way to draw one by making a turtle do it, but there's a little more complicated way that involves another famous triangle. It was known to the Chinese and Indians while we Europeans were still hiding from the Vikings, but we like to call it Pascal's Triangle after a more recent French mathematician.


The numbers can be generated by adding the numbers in the row above, but using a computer it's quicker to use the combination formula.
Here's the (Python 2) code I copied and pasted from dheerosaur on Stack Overflow:
import operator as op
...
def ncr(n, r):
r = min(r, n-r)
if r == 0: return 1
numer = reduce(op.mul, xrange(n, n-r, -1))
denom = reduce(op.mul, xrange(1, r+1))
return numer//denom
(To convert it to Python 3, just change "xrange" to "range" and add "from itertools import reduce" to the imports.)
The 1st row and column are really the 0th, so the "20" in row 7 is actually row 6, column 3:
>>> ncr(6,3)
20
How could you possibly get The Sierpinski Sieve from Pascal's Triangle? Let's use Pygame.
I use a template I found at Professor Craven's excellent Pygame tutorial. This sets up the screen and the colors and the display loop. All I have to do is draw shapes; it even updates the display and quits for me. I have to create a function to draw a triangle where I want it and what size I want it. The number (calculated with ncr above) will determine whether it's filled with color or not:
def triangle(x,y,size,filled):
'''draw an equilateral triangle'''
#if the number isn't a multiple of 2, color it in.
if filled % 2 != 0:
pygame.draw.polygon(screen,VIOLET,[[x,y],
[x-size/2.,y+1.732*size/2.],
[x+size/2.,y+1.732*size/2.]],
0)
else: thick = 0 #leave multiples of 2 empty
The "gasket" function will draw the triangles at the right spots:
def gasket(rows):
size = 400./rows #resize depending on the number of rows
for i in range(rows):
for j in range(i+1):
y = 1.732*i*size/2. #height of equilateral triangle
x = -i*size/2. + j * size + WIDTH/2. #width of triangle
triangle(x,y,size,ncr(i,j)) #draw the triangle
Now running "gasket(50)" will get you 50 rows of Pascal's triangle, with the multiples of 2 left empty:

Look familiar? You can change one digit in the "triangle" function to leave out the multiples of 3 instead:

Or the multiples of 8. The pattern of empty triangles changes every time. Try other numbers!

This blog entry has been brought to you by O'Reilly books.:-)

Sunday, March 20, 2016
Prime Testing
For decades, a common test of a computer's abilities (and its programmer's, too) is calculating prime numbers. Right now a job applicant is being asked to provide yet another function to generate primes. The largest known prime (discovered a couple of months ago) contains over 22 million digits. Yesterday a couple of students and I were working on answering the question, "What is the 10,001st prime number?" We started at the beginning, with the question of how we would tell whether a number is prime.
Obviously we'd divide it by every lower number. If there are no divisors, it's prime. The Python code for this is
def isPrime(n):
for i in range(2,n):
if n % i == 0:
return False
return True
One of my students suggested we start a list to store the primes in, so we can easily tell the program to stop when the list has reached the desired length. Here's the code for that:
def primeList(length):
primes = []
num = 2
while len(primes) < length:
if isPrime(num):
primes.append(num)
num += 1
return primes
Once we got this working correctly, my student went straight for the 10,001st:
primes = primeList(10001)
print(primes[-1]) #prints the last number in the list
Using Python's time module, you can time how long it takes to run your program. At the top of your file, you import the time module and record the starting time:
import time
time1 = time.time()
At the bottom of the code, after printing the answer, you record the ending time and print the elapsed time:
time2 = time.time()
print(time2 - time1)
On the computer the student was on this took a minute and a half. On my desktop, it took 45 seconds. Still a long time, since we wanted to generate a much bigger list of primes and save it for future use. How could we save the computer some effort?
This process of optimizing algorithms is a big deal in computer programming, and it's the reason we'll still need mathematical thinking in the digital age. Our first effort was "brute force," meaning we checked all the numbers up to n as possible divisors, and then we checked every number until we got a list of 10,001 primes. Do we really need to check all these numbers?
Obviously, after 2 there will be no more even primes. So we can skip all the even numbers. We changed our code to this:
def isPrime(n):
#start at 3 and go up to n by 2's
for i in range(3,n,2):
if n % i == 0:
return False
return True
and
def primeList(length):
primes = [2] #the only even prime
num = 3 #the next number to try
while len(primes) < length:
if isPrime(num):
primes.append(num)
num += 2 #only check odd numbers
return primes
I was sure this would cut the processing time in half, and it did. We got our 10,001st prime in 22.6 seconds.
But could we do even better? In my book Hacking Math Class with Python, I show how to speed up the process much more. To check whether a number is prime, you only have to check the numbers up to the square root of that number. Past that point, if there's a divisor, it must be multiplied by a smaller number, and you've already checked every smaller number. We changed our "isPrime" code to this:
from math import sqrt
def isPrime(n):
for i in range(3,int(sqrt(n))+1,2):
if n % i == 0:
return False
return True
Now we got our answer in 0.3 seconds!
With that kind of speed we could create a .txt file of primes to have on our computer so we wouldn't need to wait:
f = open('primelist.txt','w')
for prime in primes:
f.write(str(prime)+ ' ')
f.close()
Now we can just access the file anytime and loop through our primes without having to generate them all over again.
Obviously we'd divide it by every lower number. If there are no divisors, it's prime. The Python code for this is
def isPrime(n):
for i in range(2,n):
if n % i == 0:
return False
return True
One of my students suggested we start a list to store the primes in, so we can easily tell the program to stop when the list has reached the desired length. Here's the code for that:
def primeList(length):
primes = []
num = 2
while len(primes) < length:
if isPrime(num):
primes.append(num)
num += 1
return primes
Once we got this working correctly, my student went straight for the 10,001st:
primes = primeList(10001)
print(primes[-1]) #prints the last number in the list
Using Python's time module, you can time how long it takes to run your program. At the top of your file, you import the time module and record the starting time:
import time
time1 = time.time()
At the bottom of the code, after printing the answer, you record the ending time and print the elapsed time:
time2 = time.time()
print(time2 - time1)
On the computer the student was on this took a minute and a half. On my desktop, it took 45 seconds. Still a long time, since we wanted to generate a much bigger list of primes and save it for future use. How could we save the computer some effort?
This process of optimizing algorithms is a big deal in computer programming, and it's the reason we'll still need mathematical thinking in the digital age. Our first effort was "brute force," meaning we checked all the numbers up to n as possible divisors, and then we checked every number until we got a list of 10,001 primes. Do we really need to check all these numbers?
Obviously, after 2 there will be no more even primes. So we can skip all the even numbers. We changed our code to this:
def isPrime(n):
#start at 3 and go up to n by 2's
for i in range(3,n,2):
if n % i == 0:
return False
return True
and
def primeList(length):
primes = [2] #the only even prime
num = 3 #the next number to try
while len(primes) < length:
if isPrime(num):
primes.append(num)
num += 2 #only check odd numbers
return primes
I was sure this would cut the processing time in half, and it did. We got our 10,001st prime in 22.6 seconds.
But could we do even better? In my book Hacking Math Class with Python, I show how to speed up the process much more. To check whether a number is prime, you only have to check the numbers up to the square root of that number. Past that point, if there's a divisor, it must be multiplied by a smaller number, and you've already checked every smaller number. We changed our "isPrime" code to this:
from math import sqrt
def isPrime(n):
for i in range(3,int(sqrt(n))+1,2):
if n % i == 0:
return False
return True
Now we got our answer in 0.3 seconds!
With that kind of speed we could create a .txt file of primes to have on our computer so we wouldn't need to wait:
f = open('primelist.txt','w')
for prime in primes:
f.write(str(prime)+ ' ')
f.close()
Now we can just access the file anytime and loop through our primes without having to generate them all over again.
Saturday, March 12, 2016
Hacking the Election (Data)
A student at the Coder School was creating his own election results program, to print out who won or if there was a tie. He was doing a lot of stuff manually, like entering his own data, and writing lots of conditionals for "if Candidate_A > Candidate_B and Candidate_A > Candidate_C" and so on. I figured Python could offer us a way to get real data and visualize it in a graph.
Python has a built-in module for reading csv ("comma separated values") files you find on the web. I found a .csv file of the results of the Virginia Republican Primary, held less than two weeks ago. I downloaded it and opened it in a spreadsheet program, but it had a lot of info I wasn't interested in:

This wasn't even the whole sheet, which contained 22 columns, from "Election Name" to "District Type" to lots of crazy "IDs." I was only interested in the "Last Name" and "Total Votes" columns, D and F.
And instead of just a dozen or so rows of the total votes each candidate received in Virginia, I had 38,000 rows of all the totals for each candidate from every county in Virginia! Clearly some pruning was needed. I saved the file as "results.csv" and fired up Python to sort things out.
I started by adapting the "read_csv" function from Chapter 3 of Amit Saha's brilliant book Doing Math With Python. The csv module has a "reader" function which loops over the rows of the file. This code will open the file and start an iterator called "rows":
def read_csv(filename):
'''Returns the results in a dictionary'''
with open(filename) as f:
rows = csv.reader(f)
next(rows)
So now I can go through all the rows and add up everybody's votes. I'll put the 4 top candidates (Trump, Cruz, Rubio and Kasich) into a dictionary called "results" and start their totals at 0:
results = {'Trump':0, 'Rubio': 0, 'Cruz':0,'Kasich':0}
Now the program will loop over the rows and check if column D is one of those four names. If so, it'll add the number in column F to his total. The indices start at 0, so column D is the item in "row" with index 3, or "row[3]" and column F is "row[5]."
for row in rows:
if row[3] in results:
results[row[3]] += int(row[5])
That should work perfectly, but instead it gives me a ValueError because it hit a blank row or something. Let's just have it continue if it hits a snag like that:
for row in rows:
try:
if row[3] in results:
results[row[3]] += int(row[5])
except ValueError:
continue
Now we can print the results!
print(results)
And at the bottom of the file, call the "read_csv" function on running the program:
if __name__ == '__main__':
read_csv('results.csv')
These are the totals for the top 4 Republican candidates:
{'Kasich': 97791, 'Rubio': 327936, 'Trump': 356896, 'Cruz': 171162}
There was no mistake: those totals match the official results on http://results.elections.virginia.gov/. After printing the results we could add some code to print the winner. First we find the "key," in this case the name, associated with the maximum value. Then we print it.
winner = max(results.keys(), key=(lambda k: results[k]))
print('The winner is {0}, with {1} votes.'.\
format(winner,results[winner]))
Now it adds the winner line:
The winner is Trump, with 356896 votes.
To make a nice bar chart out of the numbers, add this code:

And here's the chart:


Update 3/13/16:
It's even easier to get the totals using a database like pandas:

Python has a built-in module for reading csv ("comma separated values") files you find on the web. I found a .csv file of the results of the Virginia Republican Primary, held less than two weeks ago. I downloaded it and opened it in a spreadsheet program, but it had a lot of info I wasn't interested in:

This wasn't even the whole sheet, which contained 22 columns, from "Election Name" to "District Type" to lots of crazy "IDs." I was only interested in the "Last Name" and "Total Votes" columns, D and F.
And instead of just a dozen or so rows of the total votes each candidate received in Virginia, I had 38,000 rows of all the totals for each candidate from every county in Virginia! Clearly some pruning was needed. I saved the file as "results.csv" and fired up Python to sort things out.
I started by adapting the "read_csv" function from Chapter 3 of Amit Saha's brilliant book Doing Math With Python. The csv module has a "reader" function which loops over the rows of the file. This code will open the file and start an iterator called "rows":
def read_csv(filename):
'''Returns the results in a dictionary'''
with open(filename) as f:
rows = csv.reader(f)
next(rows)
So now I can go through all the rows and add up everybody's votes. I'll put the 4 top candidates (Trump, Cruz, Rubio and Kasich) into a dictionary called "results" and start their totals at 0:
results = {'Trump':0, 'Rubio': 0, 'Cruz':0,'Kasich':0}
Now the program will loop over the rows and check if column D is one of those four names. If so, it'll add the number in column F to his total. The indices start at 0, so column D is the item in "row" with index 3, or "row[3]" and column F is "row[5]."
for row in rows:
if row[3] in results:
results[row[3]] += int(row[5])
That should work perfectly, but instead it gives me a ValueError because it hit a blank row or something. Let's just have it continue if it hits a snag like that:
for row in rows:
try:
if row[3] in results:
results[row[3]] += int(row[5])
except ValueError:
continue
Now we can print the results!
print(results)
And at the bottom of the file, call the "read_csv" function on running the program:
if __name__ == '__main__':
read_csv('results.csv')
These are the totals for the top 4 Republican candidates:
{'Kasich': 97791, 'Rubio': 327936, 'Trump': 356896, 'Cruz': 171162}
There was no mistake: those totals match the official results on http://results.elections.virginia.gov/. After printing the results we could add some code to print the winner. First we find the "key," in this case the name, associated with the maximum value. Then we print it.
winner = max(results.keys(), key=(lambda k: results[k]))
print('The winner is {0}, with {1} votes.'.\
format(winner,results[winner]))
Now it adds the winner line:
The winner is Trump, with 356896 votes.
To make a nice bar chart out of the numbers, add this code:

And here's the chart:

Did I leave somebody out? If you want to add a candidate, just add them to the dictionary like this:
results = {'Trump':0, 'Rubio': 0, 'Cruz':0, 'Kasich':0,
'Carson':0, 'Bush':0}
Run the program and you'll get an updated chart:

(It looks a little different because I ran it in an IPython notebook.)
A great introduction to using Python for data analysis and very timely, too!
Update 3/13/16:
It's even easier to get the totals using a database like pandas:

Subscribe to:
Posts (Atom)